
Redefining How the World Measures Progress
-
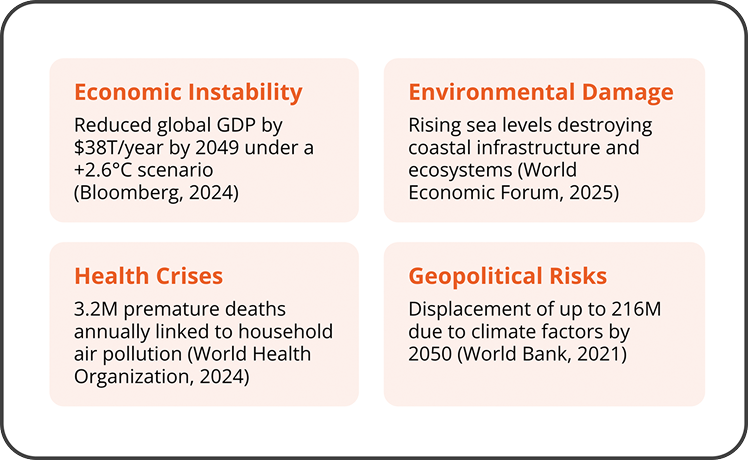
What happens as we exceed 1.5°C by 2050
-
 Graph created by CCAC | www.ccacoalition.org
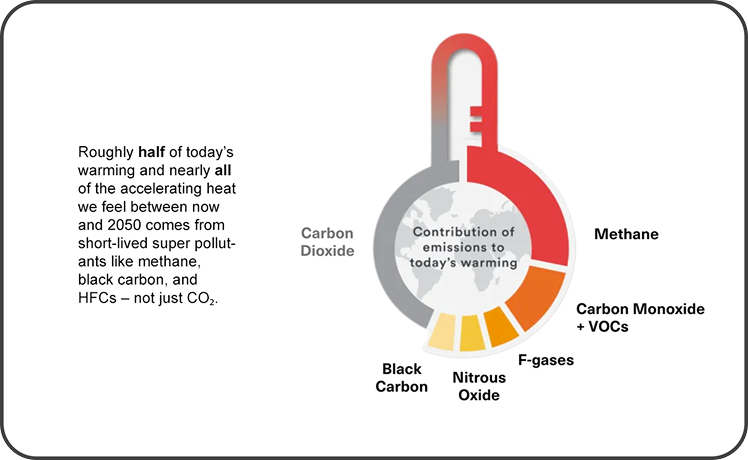
What’s driving near-term heat
-
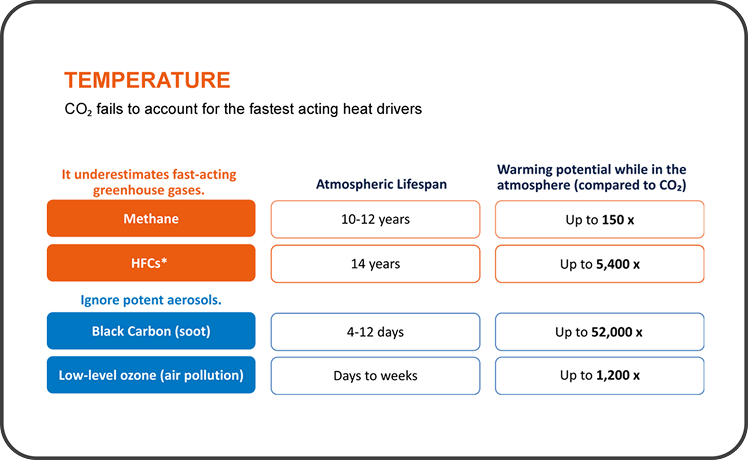
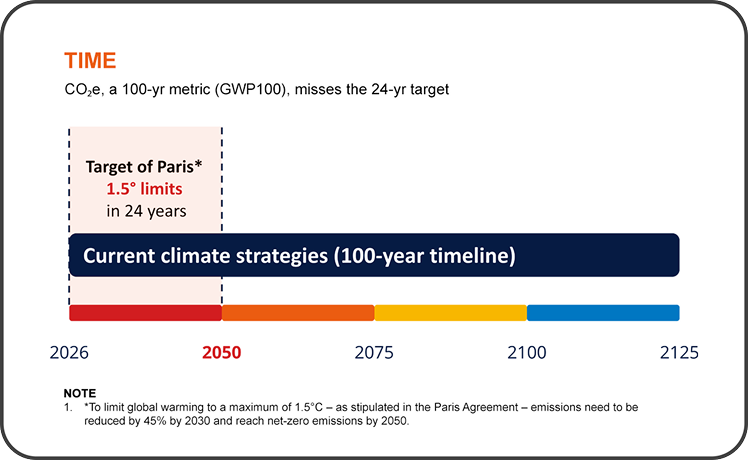
CO2e measured solely over 100 years is not sufficient to measure progress toward the 2050 goal of holding warming below 1.5°C to 2°C.
-
See our White Paper for more details.
Our Expertise
GHR has developed practical tools for strategic emissions reduction based on the Radiative Forcing Protocol, reviewed by the world’s leading climate scientists on the Science Advisory Panel of the UNEP-convened Climate and Clean Air Coalition (CCAC).
Work with us to strengthen your carbon crediting standards and methodologies to include near-term heat and pollution reduction.
Standard Development and Guidance
Methodology Development and Guidance
- GHR001 Methodology for Assessing Emissions Reductions via Collection and Destruction of HFCs
- GHR002 Methodology for Assessing Methane Recovery from Anaerobic Digestion of Manure to Produce Biogas
- GHR003 Methodology for Assessing Methane Recovery from Landfill Gas
- GHR004 Methodology for Assessing Methane Emission Reduction from Enteric Fermentation
- GHR005 Methodology for Assessing Emission Reductions from Rice Cultivation
Policy Guidance
GHR’s technical team regularly contributes to GHG accounting and climate policies.
- In 2025, we submitted recommendations to the Greenhouse Gas Protocol to advocate for the inclusion of all climate forcers and their impact on both near- and long-term timeframes. We also provided feedback on the Science Based Targets Initiative’s (SBTi) Net Zero Standard Consultation.
- Dr. Katie Kaku, GHR’s Senior Technical Director, is currently serving as an expert reviewer for the Intergovernmental Panel on Climate Change’s (IPCC) Methodology Report on Inventories for Short-lived Climate Forcers.
Get In Touch
Reach out with any questions or comments and we’ll get back to you as soon as possible.